Here's what the K-Suite Analysis helps you answer:
Your profit is real. Your cash should be too.
Schedule Your 20-Minute ReviewYour controller sees the financials. Your production manager sees the floor. Your quality team sees defects and rework. Your ops team sees schedules and deliveries.
What's usually missing is how the numbers and the plant connect to cash and to each other.
Don't ask what's behind the symptoms. Ask what pattern keeps creating them.
Here's what no single report in your business can show you:
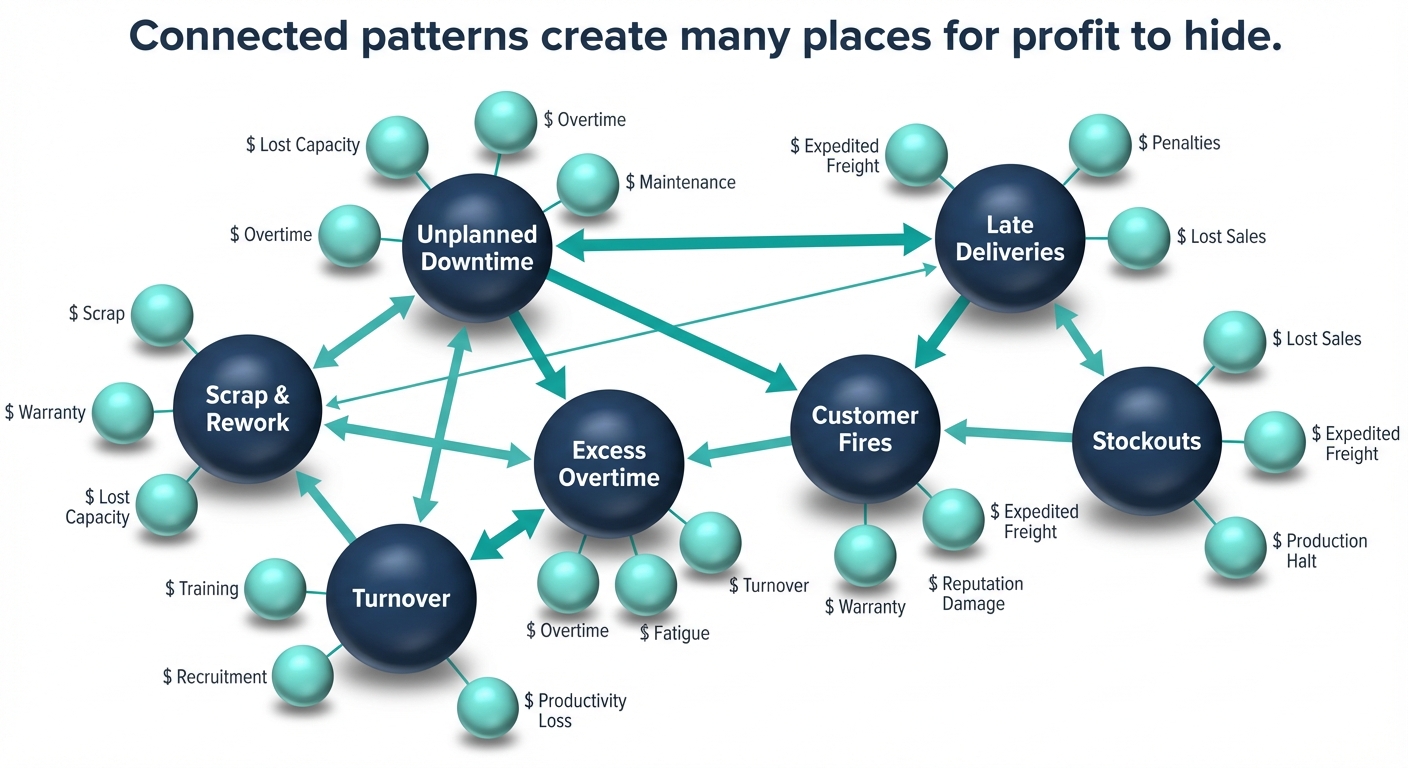
What changes the picture is being able to see how everything connects.
| Issue | Dashboards | ERP Project | Reduce Expenses | Grow Revenue | Kaufmann |
|---|---|---|---|---|---|
| Problem Solved | Visibility into operations | Standardizing data and workflows. | Reducing spend, headcount, visible waste. | Increasing volume and margin per sale. | Cash trapped in your business. |
| Area of Focus | Data, reports, KPIs | Processes, system fields, integrations. | Expense lines, labor, purchasing, shop-floor waste. | Price lists, discounts, product mix, sales behavior. | The gap between operations, financials, and cash. |
| Assumption | Better information, better decisions | "Once the new system is in, problems will settle down." | "We spend too much; cuts will restore profit." | "We can sell more and charge better prices." | There is a gap between operations and reporting. |
| Measure of Success | Faster reporting, new KPIs | Go-live, on-time project delivery, system adoption. | Savings versus last year, lower headcount. | Revenue growth, higher gross margin, better deal mix. | Profit that converts into cash in the bank. |
| Biggest Unseen Risk | More reports, same process | Locking in flawed assumptions at great expense. | Efficiency gains have a ceiling — there's only so much to cut before it affects capability. | Volume growth doesn't always improve cash if mix or pricing isn't aligned with what ops can deliver. | You recover cash but it quietly slips back into business as usual. |
One session maps why your cash and your profit don’t match — and what to do about it first.
What it delivers:
You see every number. You see how it was calculated. You decide what to do with it.
View a Sample K-Suite AnalysisThe analysis surfaces several findings. The first decision is yours — of everything it shows, which problem is the highest priority for your business right now? That's the one we focus on.
If you want to run with it —
Take the findings to your own team or your existing advisors. The work is yours. Use it however it serves you best.
If you want to turn that priority into a plan —
The K-Brief is a comprehensive project brief built around that one issue. We review it, modify it, finalize it. When you're ready, you receive the K-Plan, a step-by-step implementation plan for that specific problem.
If you want help executing —
You choose my role. Advisory support to your team. Project management. Or I bring in my own team. You stay in the lead. I come in, we solve the problem, I'm gone unless you want me to stay.
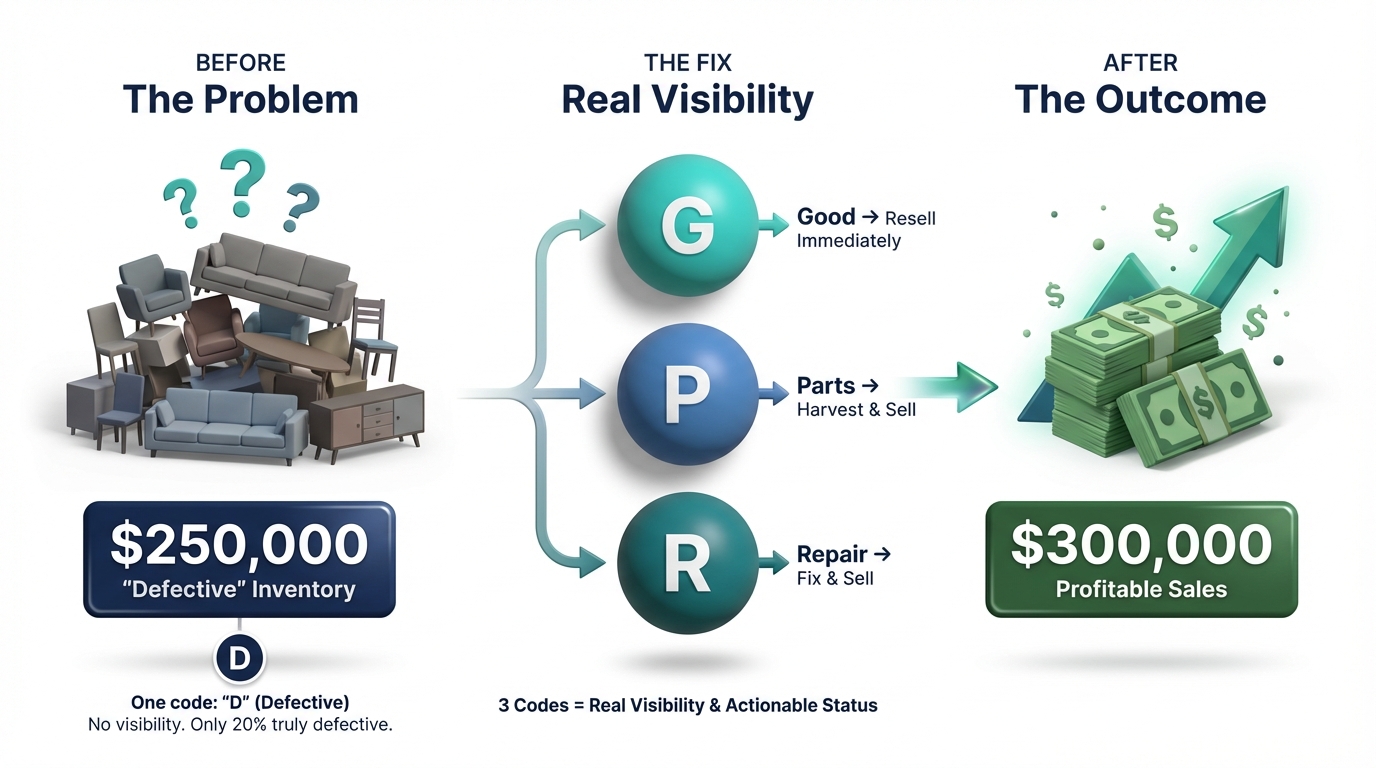
The inventory report showed $250K in defective merchandise. The assumption: write it off.
One problem. The system had a single code for everything returned or damaged: "D" for defective. A ruined table looked exactly the same as one that just needed a leg.
Only 20% was truly defective. The rest was undamaged, needed parts, or needed only a minor repair.
Three new codes later: $300K in profitable sales.
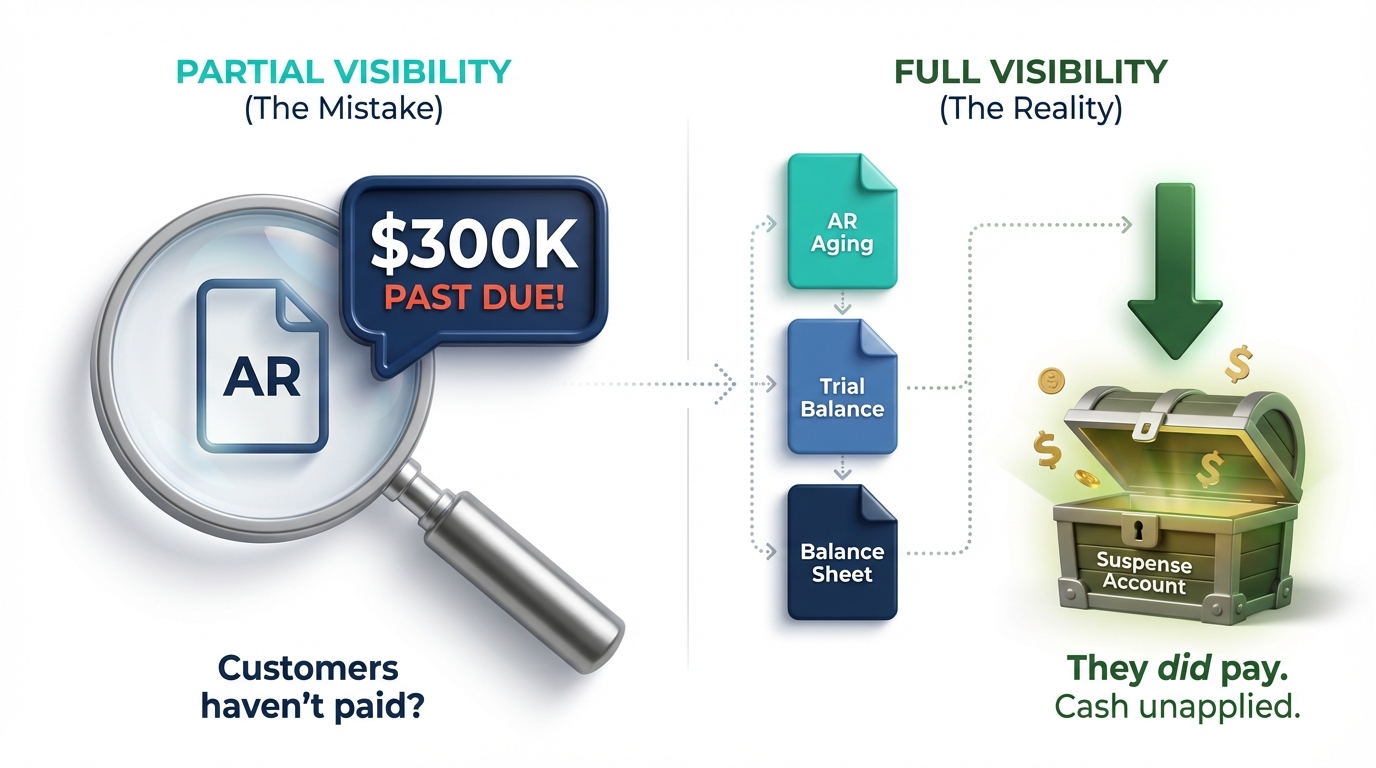
The AR aging showed $300K more than 90 days past due. The CFO was certain the customers hadn't paid.
They had.
The cash was sitting in a suspense account: received, but never matched to the invoices. The AR aging only told part of the story. Three reports pulled for the same date told the rest.
$300K that was already there.

I'm a finance guy who likes living in the ops world. I've sat inside companies as controller and operations manager — close to the floor, close to the numbers. And I've sat outside as a banker and consultant — seeing what the reports don't say. That dual view is how I find patterns others miss. If your current data told the whole story, you'd already know where your money went. Let's discuss working together to see where your profit is hiding.
Schedule a 20-minute chat.